서브메뉴
검색
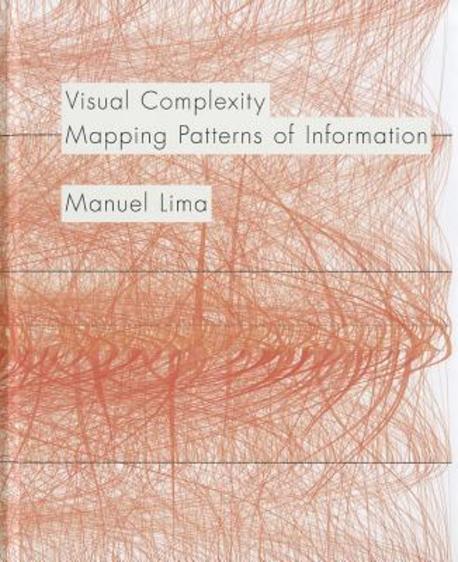
Visual complexity : mapping patterns of information
Visual complexity : mapping patterns of information
- 자료유형
- 양서단행본
- ISBN
- 9781568989365 55000
- 언어부호
- 본문언어 - eng
- DDC
- 003.54-22
- 청구기호
- 003.54 L732v
- 저자명
- Lima, Manuel , 1978-
- 서명/저자
- Visual complexity : mapping patterns of information / by Manuel Lima
- 발행사항
- New York : Princeton Architectural Press, 2011
- 형태사항
- 272p : 삽도 ; 28cm
- 서지주기
- Includes bibliographical references and index.
- 가격
- $50
- Control Number
- bwcl:80564
- 책소개
-
This text explores the vast potential of network diagrams and focuses on the long tradition of visually mapping complex networks. The book represents a middle ground in the existing spectrum of books about information-graphics design.
By the founder of VisualComplexity.com, Visual Complexity will showcase and thoroughly analyze the variety of contemporary visual depictions of complex networks.Our ability to generate information now far exceeds our capacity to understand it. Finding patterns and making meaningful connections inside complex data networks has emerged as one of the biggest challenges of the twenty-first century. In recent years, designers, researchers, and scientists have begun employing an innovative mix of colors, symbols, graphics, algorithms, and interactivity to clarify, and often beautify, the clutter. From representing networks of friends on Facebook to depicting interactions among proteins in a human cell, Visual Complexity presents one hundred of the most interesting examples of information-visualization by the fields leading practitioners.
Networks are all around us. Our brain is a network of cells, and cells themselves are networks of molecules. Societies are networks of people, and on a larger scale, food webs and ecosystems are networks of species. Networks are not just prevalent in nature but also in many manmade structures, like power grids, transportation systems, and the Internet. Network diagrams are generally made of two types of elements, nodes and connections. A node is an individual element and connections show relationships between the nodes. Visualizations help us to understand different types of networks, and the visualization of information can go well beyond the common bar chart or pie chart. In October 2005, Manuel Lima, an interaction designer and researcher, founded VisualComplexity.com, a comprehensive repository of complex network visualizations. From an initial collection of roughly 80 projects, the website quickly grew to encompass over 700 projects, with a goal to facilitate a critical understanding of a spectrum of network visualization methods. The assortment of projects -- often referred to as "map of maps" -- in this area is astounding. From representing networks of friends on Facebook or Twitter, to depicting interactions amongst proteins in a human cell, the target is truly diversified. There are visualizations mapping the ties between students, researchers, authors, politicians, developers, musicians, and terrorists; or charting the links amongst companies, institutions, web servers, web pages, blogs, emails, neurons, cities, and words. Some require hours of rendering and complex algorithms to produce, others are simply drawn by hand or using a specific drawing software. Never before we felt so strongly the notion of living in a highly interdependent world, where everything appears to be connected to everything else. This book is much more than a mere physical reproduction of VisualComplexity.com. In the tradition of Edward Tufte, Lima analyzes, collects, and presents some of the most interesting examples of information graphics in a single volume, focusing on the long tradition of mapping complex networks. The largest part of the book is a visually rich showcase of some of the most compelling contemporary examples, as well as an analysis of the range of future prospects (as discussed by leading figures in network sciences, including Christopher Kirwan, Fabien Girardin, Nathan Yau, Andrew Vande Moere, JoAnn Kuchera-Morin, Eric Rodenbeck, David McConville).
Our ability to generate information now far exceeds our capacity to understand it. Finding patterns and making meaningful connections inside complex data networks has emerged as one of the biggest challenges of the twenty-first century. In recent years, designers, researchers, and scientists have begun employing an innovative mix of colors, symbols, graphics, algorithms, and interactivity to clarify, and often beautify, the clutter. From representing networks of friends on Facebook to depicting interactions among proteins in a human cell, Visual Complexitypresents one hundred of the most interesting examples of information-visualization by the fields leading practitioners.
Our ability to generate information now far exceeds our capacity to understand it. Finding patterns and making meaningful connections inside complex data networks has emerged as one of the biggest challenges of the twenty-first century. In recent years, designers,researchers, and scientists have begun employing an innovative mix of colors, symbols, graphics, algorithms, and interactivity to clarify, and often beautify, the clutter. From representing networks of friends on Facebook to depicting interactions among proteins ina human cell, Visual Complexity presents one hundred of the most interesting examples of information visualization by the fields leading practitioners.
"A rigorously researched, beautifully designed, thoughtfully curated anthology of the worlds most compelling work at the intersection of two relatively nascent yet increasingly powerful techno-cultural phenomena, network science and information visualization.... A powerful tool in your visual literacy arsenal for navigating the Information Age. From the Bible to Wikipedia edits to the human genome, the gorgeous and thought-provoking visualizations in the book will make you look at the world in a whole new way, and the insightful essays accompanying them will vastly expand your understanding of the trends and technologies shaping our ever-evolving relationship with information." -- Brain Pickings


